Graphium Library Design
Diagram for data processing in molGPS.
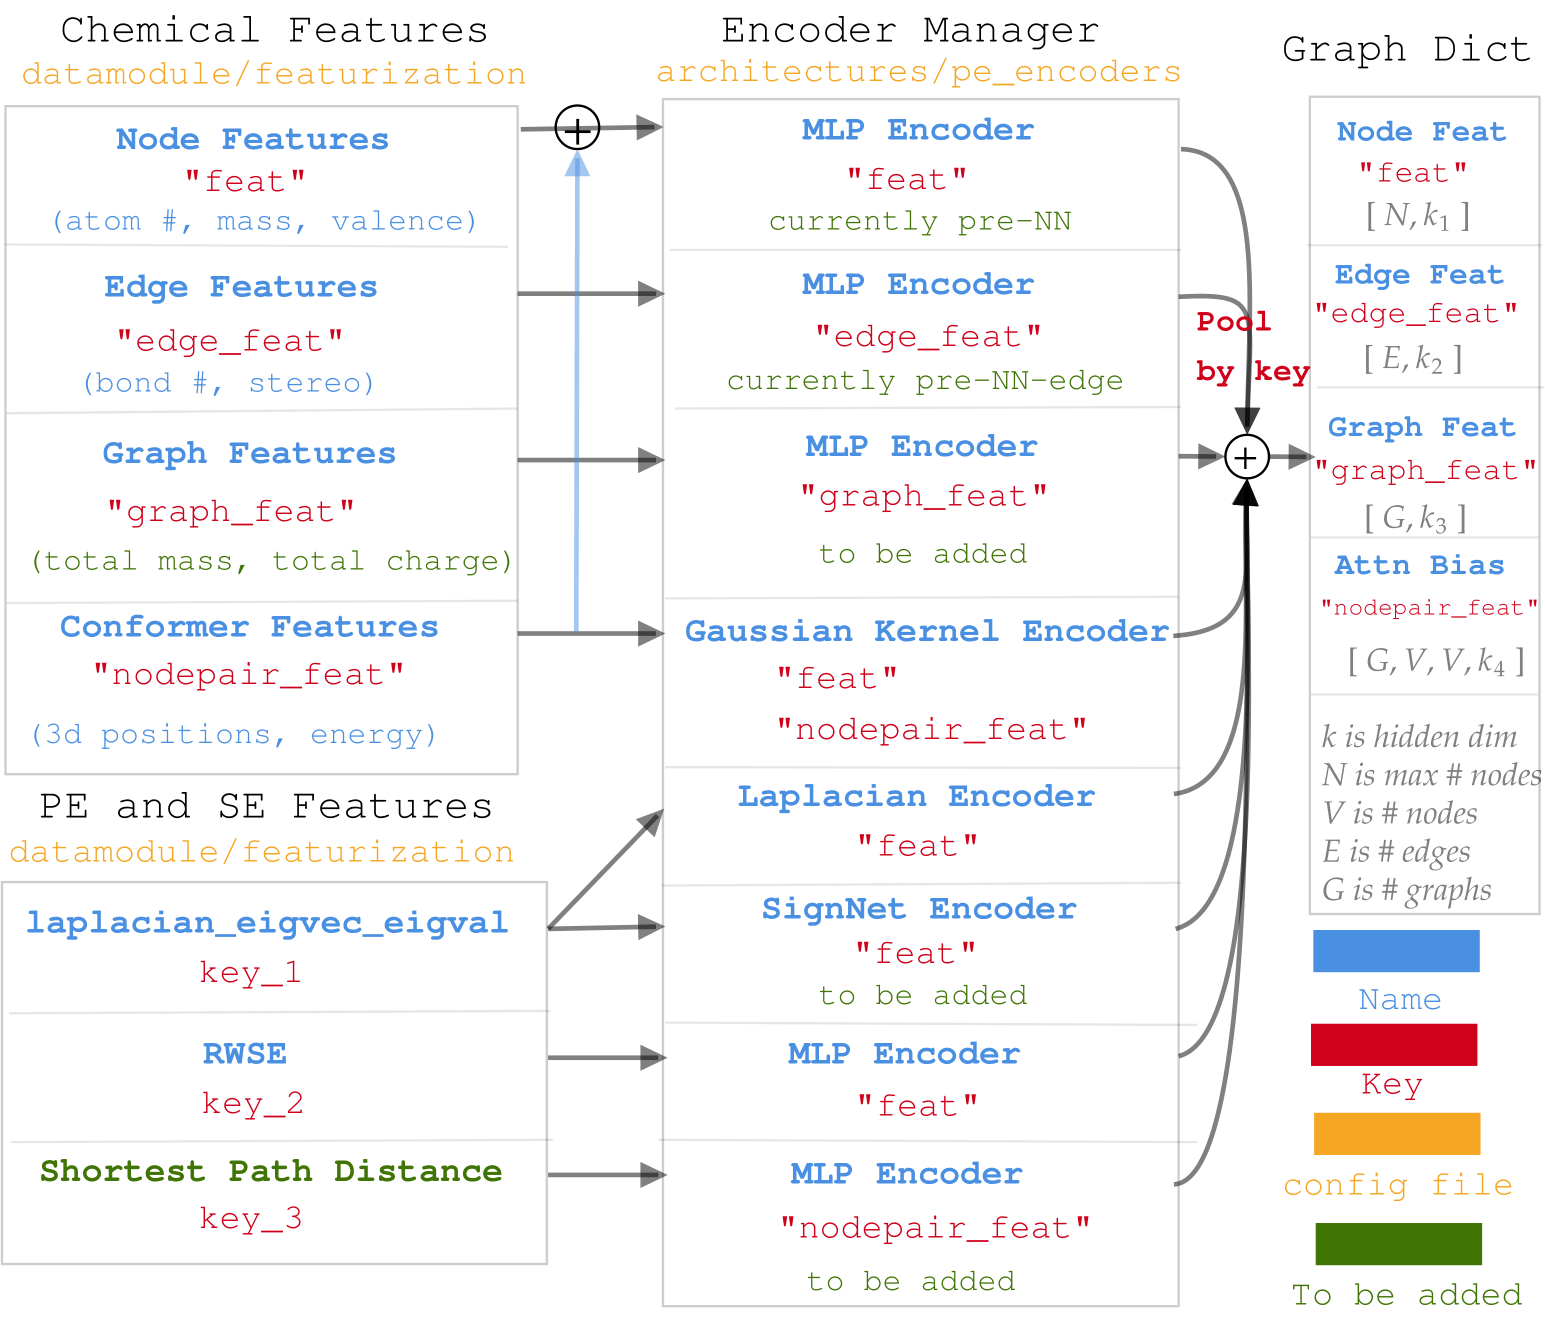
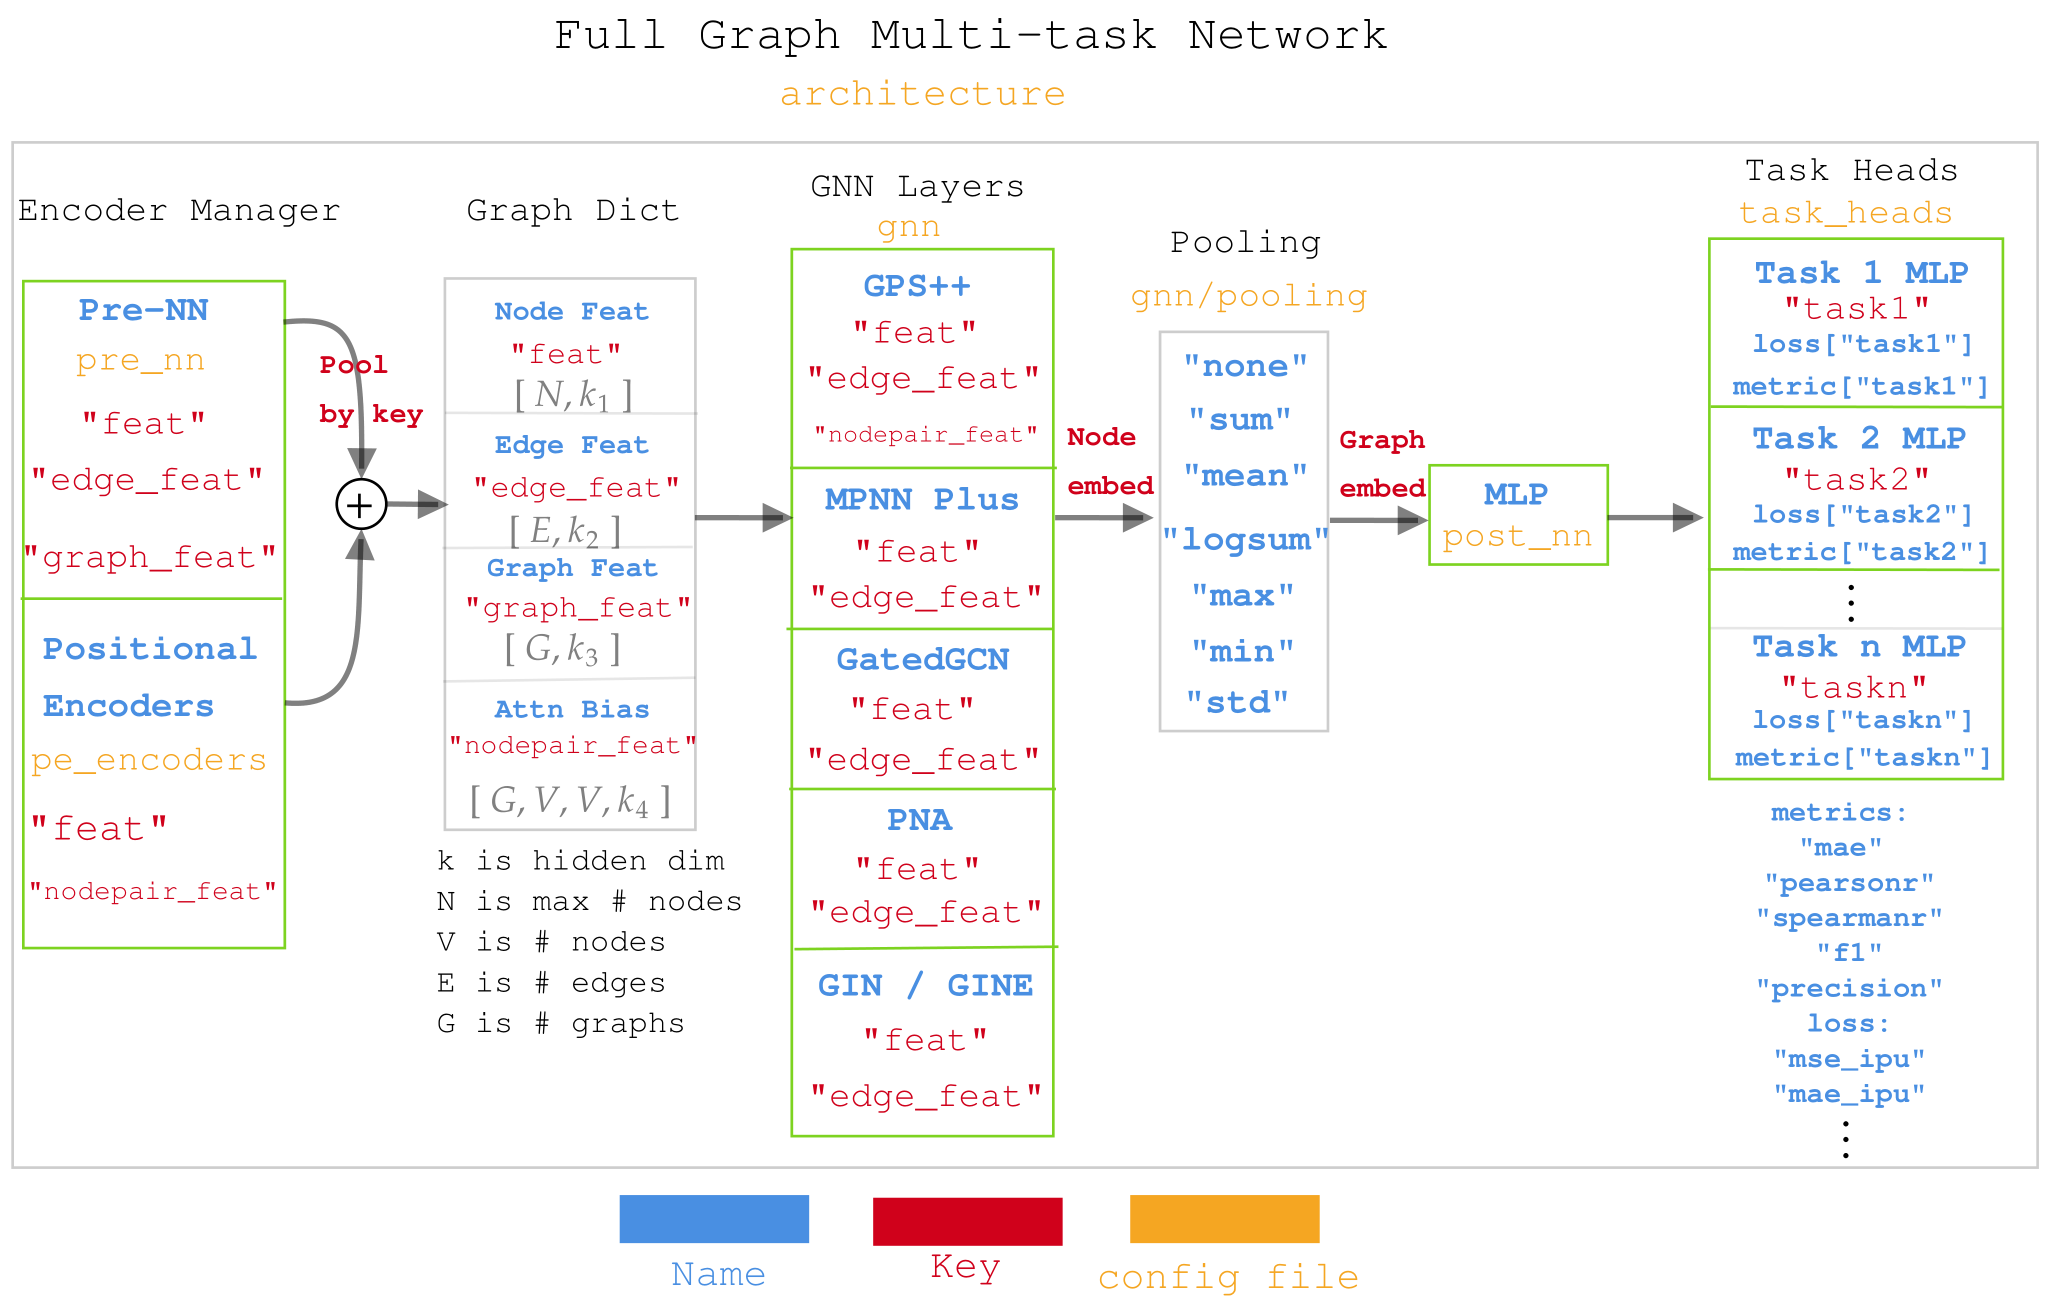
Diagram for Muti-task network in molGPS
Section from the previous README:
Data setup
Then, you need to download the data needed to run the code. Right now, we have 2 sets of data folders, present in the link here.
- micro_ZINC (Synthetic dataset)
- A small subset (1000 mols) of the ZINC dataset
- The score is the subtraction of the computed LogP and the synthetic accessibility score SA
-
The data must be downloaded to the folder
./graphium/data/micro_ZINC/ -
ZINC_bench_gnn (Synthetic dataset)
- A subset (12000 mols) of the ZINC dataset
- The score is the subtraction of the computed LogP and the synthetic accessibility score SA
- These are the same 12k molecules provided by the Benchmarking-gnn repository.
- We provide the pre-processed graphs in
ZINC_bench_gnn/data_from_benchmark - We provide the SMILES in
ZINC_bench_gnn/smiles_score.csv, with the train-val-test indexes in the fileindexes_train_val_test.csv. - The first 10k elements are the training set
- The next 1k the valid set
- The last 1k the test set.
- We provide the pre-processed graphs in
- The data must be downloaded to the folder
./graphium/data/ZINC_bench_gnn/
Then, you can run the main file to make sure that all the dependancies are correctly installed and that the code works as expected.
python expts/main_micro_zinc.py
TODO: explain the internal design of Graphium so people can contribute to it more easily.
Structure of the code
The code is built to rapidly iterate on different architectures of neural networks (NN) and graph neural networks (GNN) with Pytorch. The main focus of this work is molecular tasks, and we use the package rdkit to transform molecular SMILES into graphs.
data_parser
This folder contains tools that allow tdependenciesrent kind of molecular data files, such as .csv or .xlsx with SMILES data, or .sdf files with 3D data.
features
Different utilities for molecules, such as Smiles to adjacency graph transformer, molecular property extraction, atomic properties, bond properties, ...
The MolecularTransformer and AdjGraphTransformer come from ivbase, but I don't like them. I think we should replace them with something simpler and give more flexibility for combining one-hot embedding with physical properties embedding..
trainer
The trainer contains the interface to the pytorch-lightning library, with PredictorModule being the main class used for any NN model, either for regression or classification. It also contains some modifications to the logger from pytorch-lightning to enable more flexibility.
utils
Any kind of utilities that can be used anywhere, including argument checkers and configuration loader
visualization
Plot visualization tools
Modifying the code
Adding a new GNN layer
Any new GNN layer must inherit from the class graphium.nn.base_graph_layer.BaseGraphLayer and be implemented in the folder graphium/nn/pyg_layers, imported in the file graphium/nn/architectures.py, and in the same file, added to the function FeedForwardGraph._parse_gnn_layer.
To be used in the configuration file as a graphium.model.layer_name, it must also be implemented with some variable parameters in the file expts/config_gnns.yaml.
Adding a new NN architecture
All NN and GNN architectures compatible with the pyg library are provided in the file graphium/nn/global_architectures.py. When implementing a new architecture, it is highly recommended to inherit from graphium.nn.architectures.FeedForwardNN for regular neural networks, from graphium.nn.global_architectures.FeedForwardGraph for pyg neural network, or from any of their sub-classes.
Changing the PredictorModule and loss function
The PredictorModule is a general pytorch-lightning module that should work with any kind of pytorch.nn.Module or pl.LightningModule. The class defines a structure of including models, loss functions, batch sizes, collate functions, metrics...
Some loss functions are already implemented in the PredictorModule, including mse, bce, mae, cosine, but some tasks will require more complex loss functions. One can add any new function in graphium.trainer.predictor.PredictorModule._parse_loss_fun.
Changing the metrics used
!WARNING! The metrics implementation was done for pytorch-lightning v0.8. There has been major changes to how the metrics are used and defined, so the whole implementation must change.
Our current code is compatible with the metrics defined by pytorch-lightning, which include a great set of metrics. We also added the PearsonR and SpearmanR as they are important correlation metrics. You can define any new metric in the file graphium/trainer/metrics.py. The metric must inherit from TensorMetric and must be added to the dictionary graphium.trainer.metrics.METRICS_DICT.
To use the metric, you can easily add it's name from METRICS_DICT in the yaml configuration file, at the address metrics.metrics_dict. Each metric has an underlying dictionnary with a mandatory threshold key containing information on how to threshold the prediction/target before computing the metric. Any kwargs arguments of the metric must also be added.